 Nepal - Earthquake - Average monthly precipitation - July
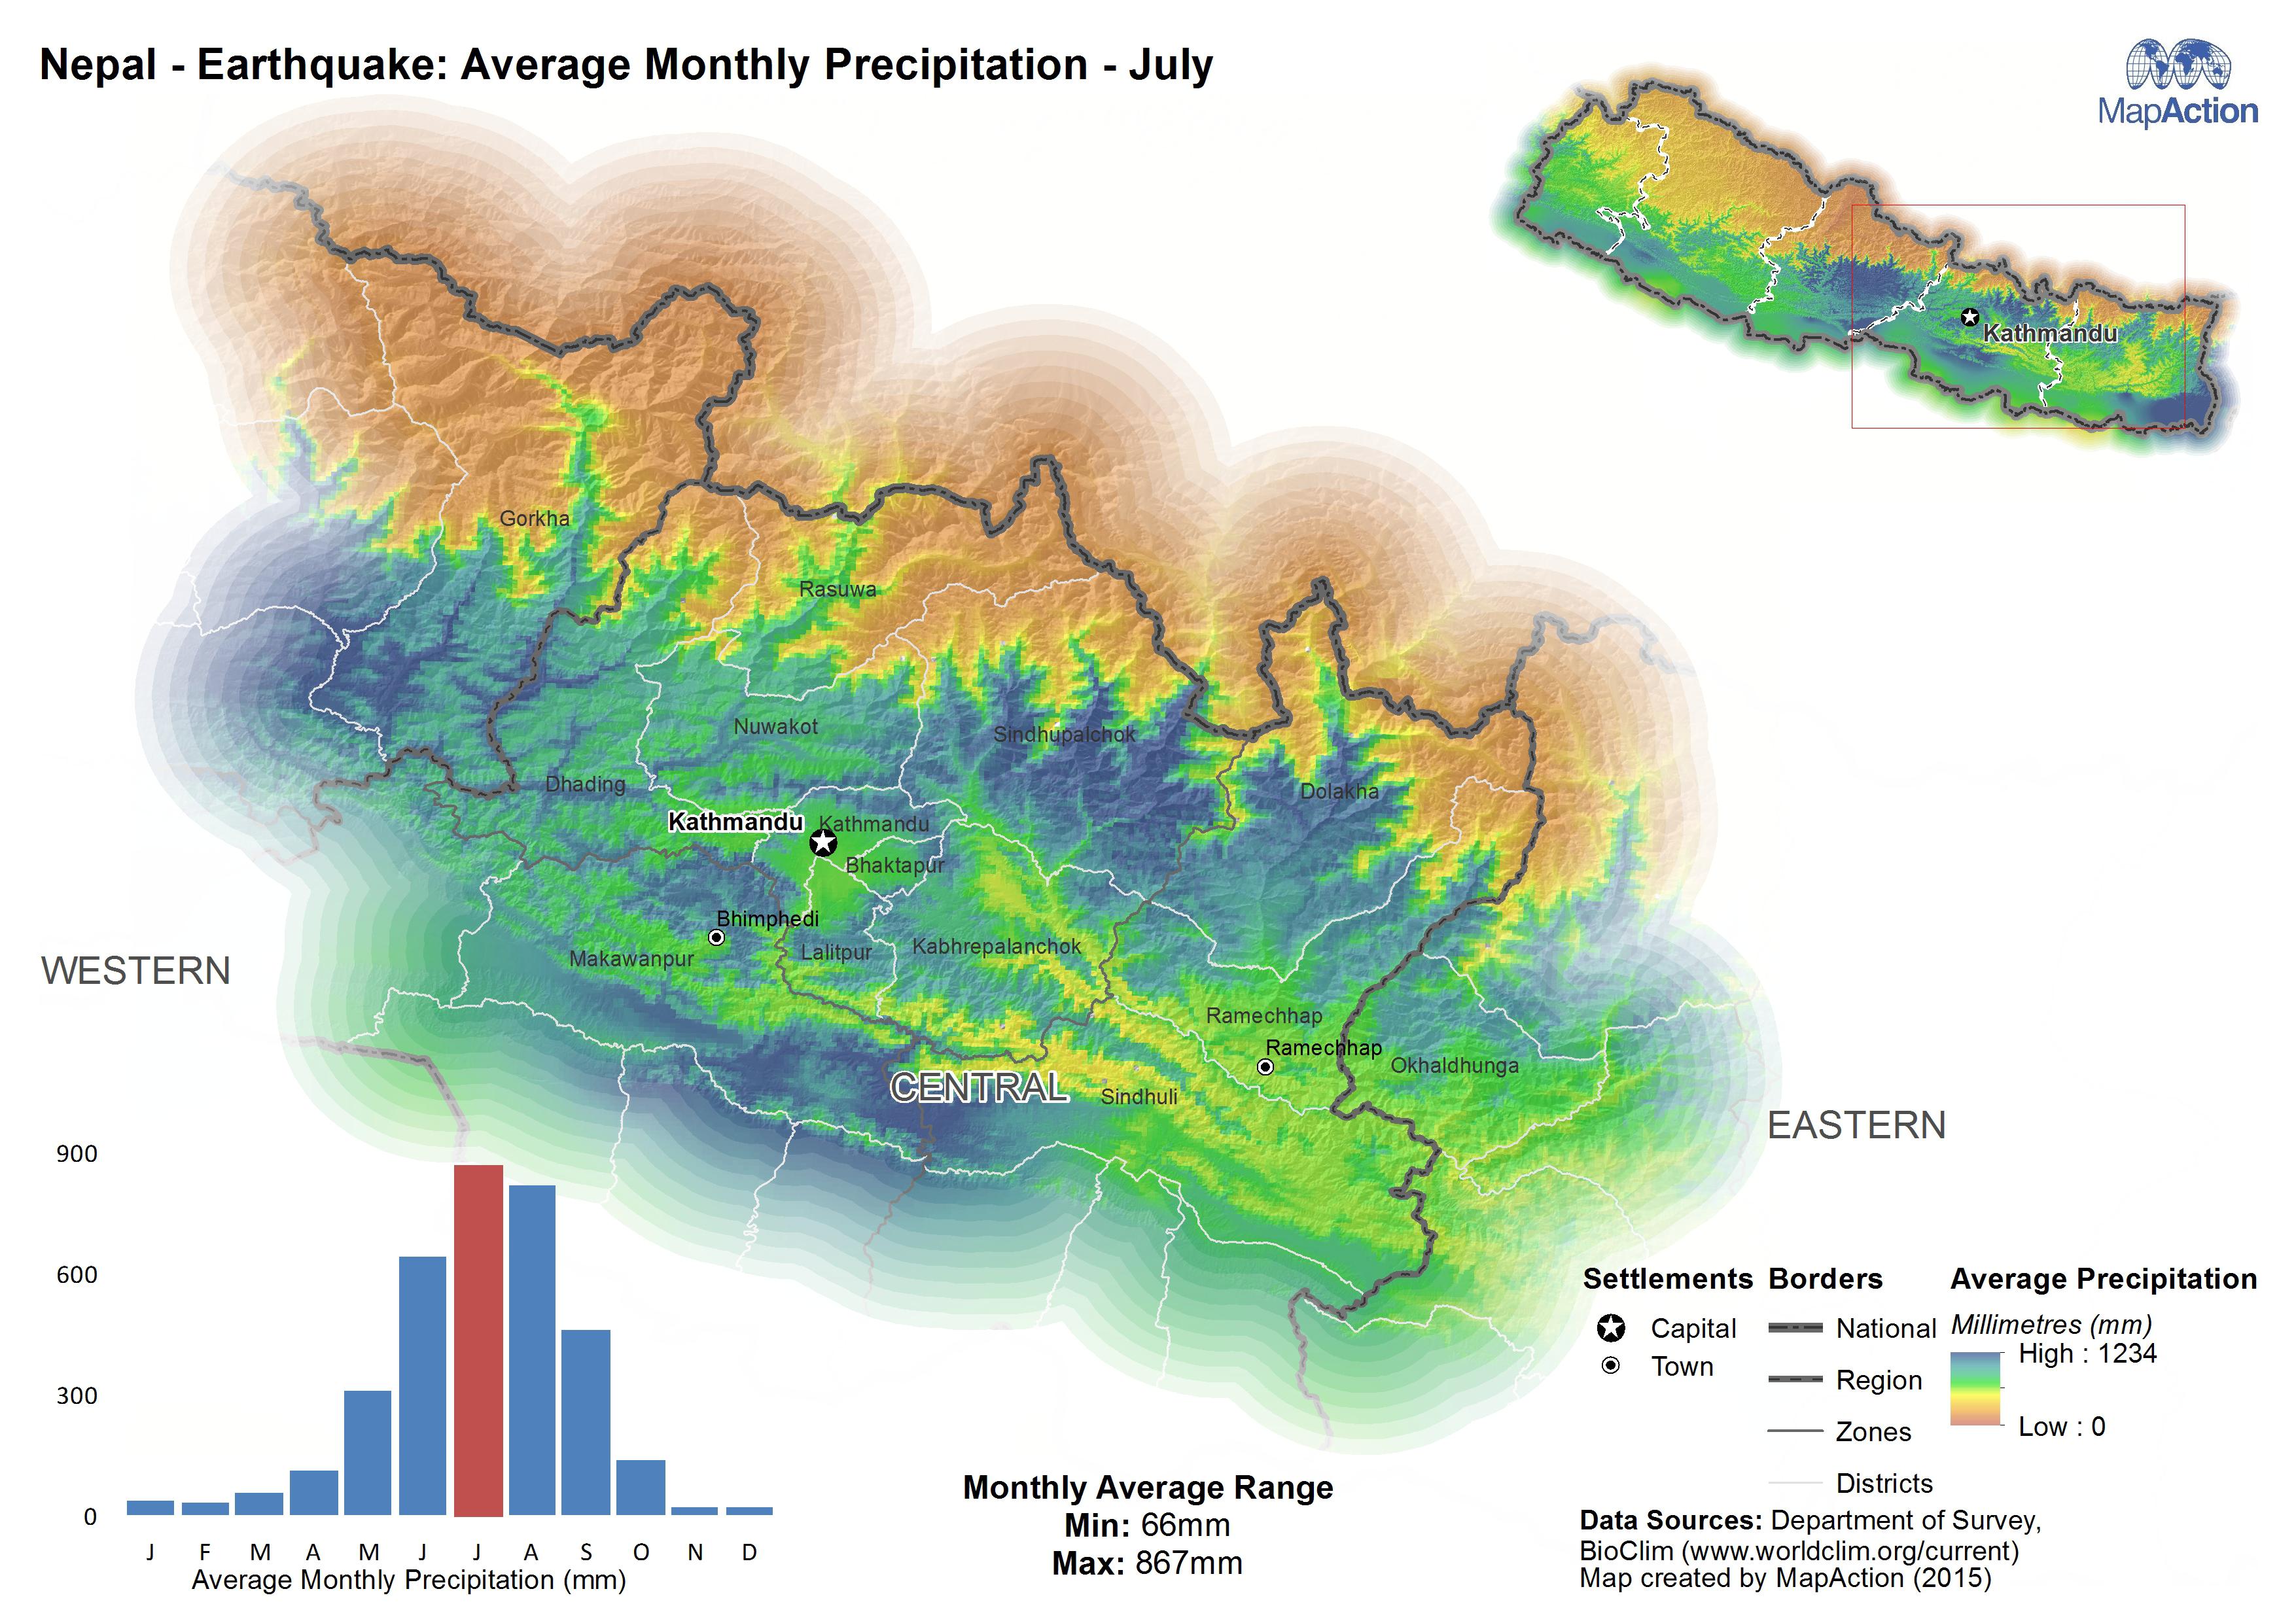
During many emergency responses weather will play some role, either as the trigger event e.g. a cyclone, heavy rain, extreme temperature (hot or cold), or to inform responders for longer term planning such as winterisation.
Strategic or operational?
Both.
Basemap, baseline or situational?
Situational.
When might it be produced?
If the response has been triggered due to a weather event then immediately, and these should then be updated once a day, particularly for floods where rainfall will have an impact. For longer term planning, creating products with monthly averages can be done well in advance.
Intended audience
Almost all responders, particularly urban search and rescue teams, pilots, logisticians and those involved with winterisation.
Influence on humanitarian decisions
The weather will have a series of different effects for different users. For search and rescue teams and pilots, poor weather (high precipitation, cloud cover or wind) may hamper their ability to operate. Heavy rainfall may make roads impassable, hampering the work of logisticians trying to move aid using trucks. The lack of rainfall or extreme temperatures may impact on agriculture, making it difficult for crops to grow. The weather will also determine the type of shelter that is used in camps or temporary shelters, i.e. is there a need to provide shelter from extreme temperatures, heavy rain, snowfall, etc. Conversely there may be improvements in a response. A reduction in rain during flooding will put less strain on river systems that are close to or over capacity. It will also help improve road conditions. In areas of drought, rainfall will begin to help improve conditions by providing water that is much-needed. A rise in temperatures during cold weather events will put less strain on fuel for keeping warm, etc.
Methods
- For cyclones and flooding produce maps showing rainfall and storm paths, including wind strength. These should be produced daily and updated as required.
- For long-term planning produce monthly snapshots showing maximum and minimum temperatures and precipitation.
- For a time series of products consider the scale and how it should be classified across the full time period. Look at the maximum and minimum extents of the range and use these for each period. Once the scale and classification have been calculated, use the same colour ramp in the symbology. Doing so makes it easier for the user to compare each month.
Data
- Daily rainfall: Global Precipitation Measurement (GPM)
- Monthly averages: WorldClim - Global Climate Data
- Joint Typhoon Warning Center (JTWC)