 Cape Verde - Fogo Island - Volcanic eruption (as of 9 Dec 2014)
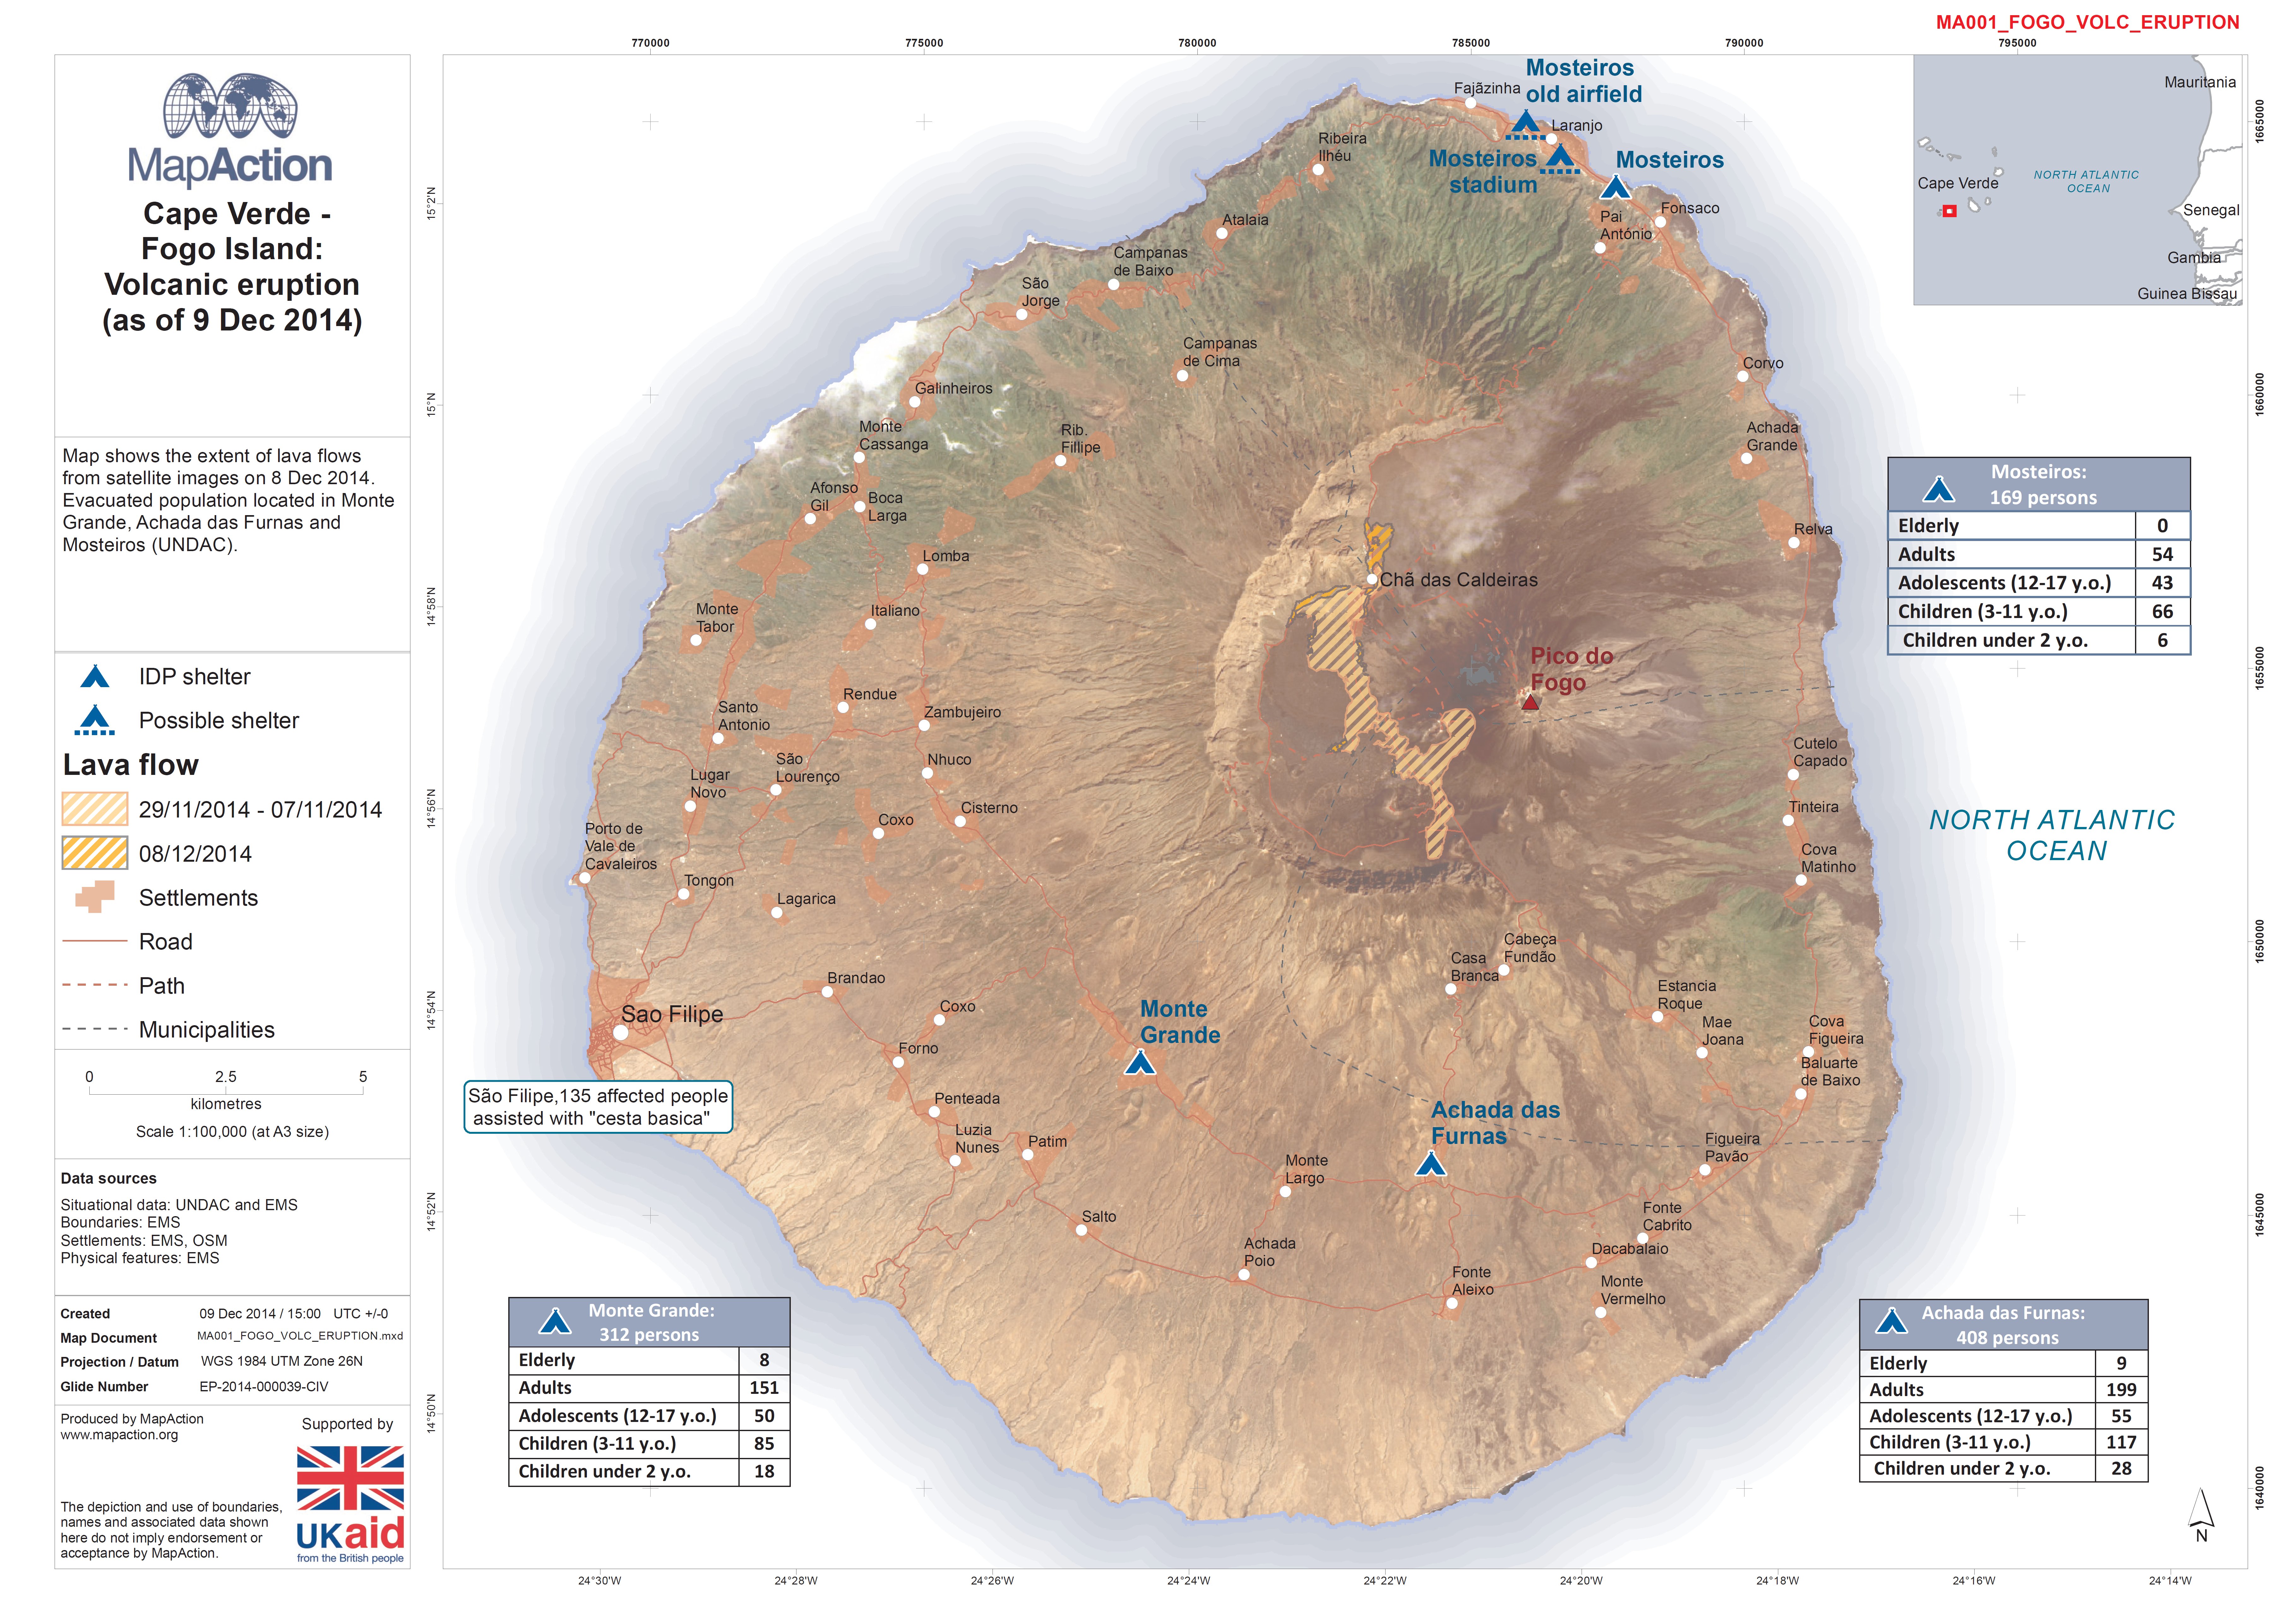
Maps relating to volcanic activity may show pre-existing lava and pyroclastic flows, vents and craters. They may also show other associated hazards such as new lava flows, volcanic gas, lahars, jökulhlaups and pyroclastic flows. Decision-makers will be looking to identify possible evacuation routes from these maps.
Strategic or operational?
Both
Basemap, baseline or situational?
Basemap and situational.
When might it be produced?
Pre-existing geological maps may already exist and these can be used early on. As the situational data arrives it is important that the maps are updated. This is particularly the case where volcanic gas and ash clouds are present and there is wind and rain in the area, which will influence which direction the ash will carry and how much is in the air.
Intended audience
Civil defence and anyone involved with evacuation.
Influence on humanitarian decisions
Decision-makers are going to be interested in identifying evacuation routes and safe zones. Basemaps may show pre-existing lava and pyroclastic flows, vents and craters. Volcanic hazards that may need to be mapped or may influence decision-making include:
- Lava flows: molten rock that is expelled during a volcanic eruption and moves downhill.
- Volcanic gas: this will be released by a volcano typically as water vapour, but also as carbon dioxide, carbon monoxide, sulphur oxides, hydrogen sulfide, chlorine and fluorine. Most of the time volcanic gases are noxious, but they can cause mass fatalities.
- Lahars: these are particular types of mud flows containing a mixture of pyroclastic materials, rocky debris and water. These can occur as a result of heavy rainfall, the rapid draining of a crater lake or melting ice. These flows can be highly damaging. When the flows stop they can become as solid as concrete.
- Jökulhlaups: this is a kind of glacial outburst flood associated with geothermal activity under a glacier.
- Pyroclastic flows: a fast moving current of hot gas and rock that flows down and away from the volcano.
Methods
Create distance buffers around the volcano. These can then be used to identify villages and communities possibly within reach of gas and ash clouds. Distance products depicting the spread of gas and ash can be produced by using wind direction and speed.
Data
- Geological mapping showing vents and other hazards.
- Ash and gas cloud.
- Wind direction and speed.