 When producing maps it is important for the data to be represented in a clear way that the user can understand. The symbols or icons should be representative of the data being shown. A map should not show too much information and only used the data that is going to support the overall theme of the map. Too much information may make the map confusing to the user.
The following two examples are tools that can help in representing data in a clear way.
When producing maps it is important for the data to be represented in a clear way that the user can understand. The symbols or icons should be representative of the data being shown. A map should not show too much information and only used the data that is going to support the overall theme of the map. Too much information may make the map confusing to the user.
The following two examples are tools that can help in representing data in a clear way.
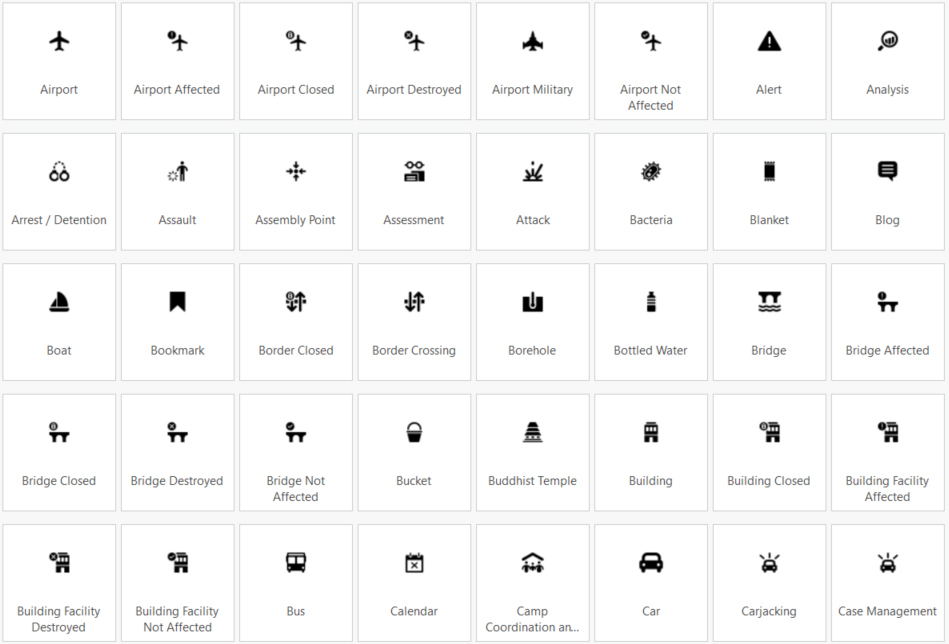
Humanitarian icons
The United Nations Office for the Coordination of Humanitarian affairs (OCHA). MapAction has supported in the creation of the various GIS ready formats for ESRI (ArcMap and ArcGIS Pro) and QGIS.
ColorBrewer
This is a tool that can help in the use of colour in a map particularly in choropleth maps where colours are used to represent a classified data. In these maps it is recommended not to use more that six classifications as if it is more than that then it is harder to distinguish by the human eye. The ColorBrewer tools allows the map creator to test different colour palettes for different classifications but also making sure that they are colour blind and photocopy friendly.